


 Sign in
 Profile
 Signout
ISC Class 12th Economics Exam 2024 : Most Important Question with Solution for Last-Minute Revision


ISC 12th exams are going on and your Economics paper is scheduled on February 23, 2024. You have only a few hours left for the Economics exam.
We've got you covered with the ultimate last-minute revision tool - the Most Important Revision Question! These specially curated notes are designed to give you a quick and effective revision session right before your exam. Whether you need to consolidate your knowledge or refresh your memory.
In this, every important question has been sorted and collected, which is very important for your paper, so that the student can score good marks in less time. Answers to all the questions are given together.
ISC Class 12 Economics Exam 2024 : Most Important Questions Answers
(i) Refer to the graph given below and determine the behaviour of TU as MU decreases up to the point ‘b’.
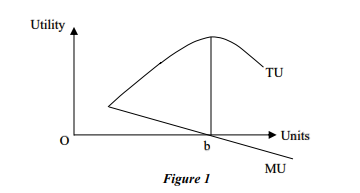
(a) TU increases up to a limit and remains positive.
(b) TU increases at an increasing rate
(c) TU increases at a diminishing rate.
(d) TU is at a point of satiety.
(ii) GST has been imposed at the rate of 5% both on edible oil and a few spices. In this situation, the supply curve of edible oil will:
(a) shift leftward.
(b) shift rightward.
(c) not change its position.
(d) slope downward.
(iii) Identify the good that has a direct price-demand relationship.
(a) Giffen Good
(b) Complementary Good
(c) Normal Good
(d) Inferior Good
(iv) How would rational consumers react to a situation when the price of the car remains constant but the price of the petrol increases?
(a) They would tend to buy less cars.
(b) They would tend to buy more cars.
(c) They would not react to the situation.
(d) They would wait for the price of petrol to come down.
(v) Which type of tax discourages people from making more money as it can lead to class warfare and individuals hiding income or assets?
(a) A small percentage of tax charged on an individual’s income.
(b) A fixed percentage of tax charged on an individual’s income.
(c) Tax charged at a decreasing rate when income of the individual increases.
(d) Tax charged at an increasing rate when income of the individual increases.
(vi) Which one of the following best illustrates leakages in the circular flow of income?
(a) Investment
(b) Export earning
(c) Savings by households
(d) Government expenditure
(vii) A firm’s demand curve shows highest elasticity in:
(a) Monopoly market.
(b) Perfectly Competitive market.
(c) Monopolistic competitive market.
(d) Oligopoly market.
(viii) Identify the equilibrium of the firm in the graph given below:
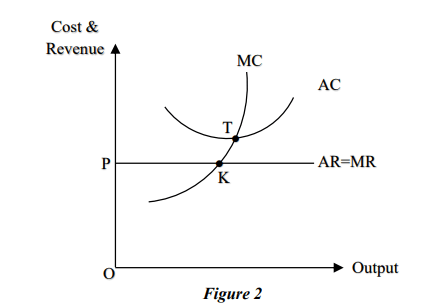
(a) T is the equilibrium point at which firm enjoys supernormal profit.
(b) K is the equilibrium point when firm faces losses.
(c) T is the equilibrium point causing normal profit to the firm.
(d) K indicates equilibrium which reveals zero profit to the producer
(ix) Assertion: Price discrimination is possible only in a monopoly market.
Reason: AR curve of a monopoly firm exhibits the market demand for the commodity.
(a) Both Assertion and Reason are true, and Reason is the correct explanation for Assertion.
(b) Both Assertion and Reason are true, but Reason is not the correct explanation for Assertion.
(c) Assertion is true and Reason is false.
(d) Both Assertion and Reason are false
(x) In an economy, how much additional investment should be generated in the private sector to raise national income by ₹450 Cr. while MPC is 0·6?
Ans: In an economy where the marginal propensity to consume (MPC) is 0.6, an additional investment of approximately ₹180 crore would be required in the private sector to raise national income by ₹450 crore.
Here's the breakdown:
- Multiplier effect: When there's an increase in investment, it leads to a larger increase in national income due to the multiplier effect. This effect arises because a portion of the initial investment is spent by individuals and businesses, which creates further income for others, who in turn spend a portion of that income, and so on.
- Calculating the multiplier: The multiplier is calculated as 1 / (1 - MPC). In this case, with MPC being 0.6, the multiplier is 1 / (1 - 0.6) = 2.5.
- Additional investment needed: To achieve the desired increase in national income (₹450 crore), we can use the following formula: Additional investment = Desired increase in national income / Multiplier. Therefore, Additional investment = ₹450 crore / 2.5 = ₹180 crore.
Therefore, an additional investment of ₹180 crore in the private sector would trigger a chain reaction of consumption and spending, ultimately leading to a ₹450 crore increase in national income.
(xi) How does an increase in national income affect the income-elastic investment in the economy?
Ans: The effect of an increase in national income on income-elastic investment in the economy depends on several factors and can be complex. Here's a breakdown of the key considerations:
1. Income Elasticity of Investment:
- This measures the responsiveness of investment to changes in national income. A value of 1 means investment grows proportionately with income, while values above 1 indicate investment grows faster than income (more elastic), and values below 1 indicate investment grows slower (less elastic).
2. Types of Investment:
- Different types of investment exhibit varying income elasticities. For example, investments in luxury goods or infrastructure might be more elastic than investments in essential necessities.
3. Economic and Financial Conditions:
- Factors like interest rates, availability of credit, economic uncertainty, and investor sentiment can influence how income changes translate into investment decisions.
4. Government Policies:
- Tax policies, incentives, and regulations can impact the attractiveness of different investments and influence how national income changes affect them.
(xii) An economy can have a fiscal deficit without a revenue deficit. Give one reason to support this statement.
Ans: This is possible because fiscal deficit is worked out by accounting for both the revenue and capital receipts and expenditures of the government. So, even when revenue receipts and revenue expenditure are in a state of balance, there could be excess of capital expenditure over capital receipts causing a fiscal deficit.
(xiii) State whether the following is True or False. Give one reason for your answer. Change in inventory is a stock concept.
Ans: False. While inventory itself is a stock concept, change in inventory is a flow concept.
Reasoning: Inventory refers to the amount of goods a company has on hand at a specific point in time. It's a snapshot of a static quantity. On the other hand, change in inventory measures the difference in inventory levels between two different points in time, capturing the movement of goods in and out of the company over a period. Since it relates to a period of time, it's considered a flow concept.
(xiv) State any one difference between Perfect competition and Monopolistic competition.
Ans: Perfect competition:
- Firms offer identical products. Consumers see no meaningful difference between products offered by different firms, making them perfect substitutes.
- Firms are price takers, meaning they have no control over the market price and simply accept the prevailing market price set by supply and demand.
Monopolistic competition:
- Firms offer differentiated products with unique features, branding, or quality. While products may serve the same basic function, they have distinct characteristics that give firms some leeway in setting prices.
- Firms have some degree of market power, allowing them to charge slightly higher prices than in perfect competition due to product differentiation. However, this power is limited by competition from other firms offering similar products.
(xv) Full employment does not necessarily imply zero unemployment. Justify.
Ans: Full employment is not the same as zero unemployment because there are different types of unemployment, and some are unavoidable or even necessary for a functioning labor market. At any given time, jobs are being created and destroyed as industries evolve, and the transition from old jobs to new is not seamless.
(xvi) How is deflationary gap generated in the economy?
Ans: A deflationary gap occurs when the actual real GDP is below its potential output. In this situation, some economic resources are underutilized, which in turn, creating a downward pressure on price level. This term is synonymous with the recessionary gap.
SECTION B – 32 MARKS
Question 2 (i) It is claimed that Artificial Intelligence can help the manufacturing industries improve their efficiency.
How will this impact the supply of the product by the manufacturing industries? Show the impact with the help of a diagram.
Ans:
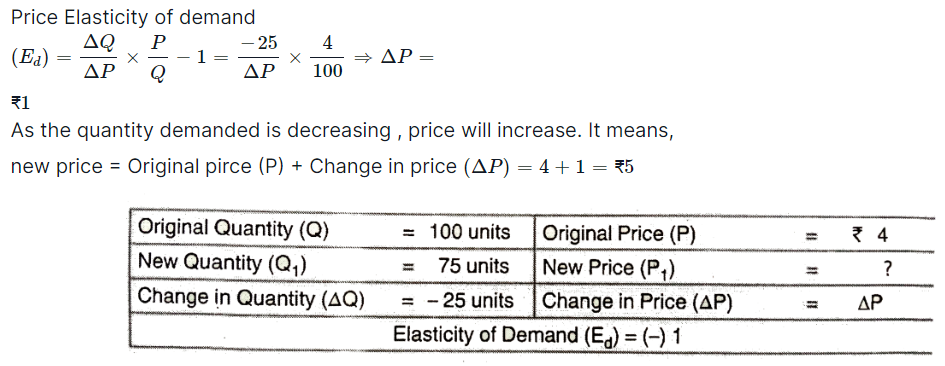
(ii) The market demand for a commodity at ₹ 8 per unit is 100 units. The price rises and as a result, its market demand falls to 75 units. Find out the new price of the commodity if the price elasticity of demand is -1.
Ans:
Question 3 What does the difference between fiscal deficit and interest payments imply? What does ‘zero difference’ mean in this case?
Ans: Fiscal Deficit:
- Measures the overall budget gap of a government in a financial year.
- Calculated as the difference between total government expenditure and total government revenue excluding borrowings.
- A positive fiscal deficit means the government spends more than it earns, leading to borrowing.
- A negative fiscal deficit indicates a surplus, where revenue exceeds expenditure.
Primary Deficit:
- Focuses on the government's current spending needs, excluding past borrowing costs.
- Calculated by subtracting interest payments on existing debt from the fiscal deficit.
- Provides a clearer picture of the government's ability to finance its ongoing expenses without relying on past debt.
- A positive primary deficit suggests the government needs to borrow even to cover its non-interest expenditures.
- A negative primary deficit implies the government can manage its current spending without new borrowing.
Relationship between them:
- Primary deficit = Fiscal deficit - Interest payments
Question 4. Why is the short run average cost curve U-shaped?
Ans: The U shape of SAC curve is directly due to the law of variable proportions, since in the short run some factors are fixed and some are variable.
Question 5 (i) Explain any two causes of restricted entry in a monopoly market structure.
Ans:
1) Government-imposed barriers:
- Licenses and permits: The government can restrict entry by requiring new companies to obtain specific licenses or permits, often involving lengthy and challenging application processes. These licenses might be limited in number, creating artificial scarcity and shutting out potential competitors.
- Regulation and legal monopolies: In some industries, the government grants exclusive rights to a single company through outright legal monopolies. This could be for reasons like maintaining critical infrastructure or controlling sensitive resources.
2) Natural barriers:
- Economies of scale: Monopolies may benefit from economies of scale, where their large size allows them to produce goods or services at a much lower cost per unit than potential competitors. This cost advantage makes it difficult for new entrants to compete on price.
- Network effects: Some monopolies enjoy network effects, where the value of their product or service increases as more people use it. For example, social media platforms become more valuable as more users join, making it difficult for new platforms to attract a critical mass of users.
(ii) The demand curve of a firm is more elastic under monopolistic competition than under monopoly. Explain.
Ans: The demand curve under monopolistic competition is more elastic than under monopoly. The reason behind this can be attributed to the fact that the nature of the goods available in both the markets is different. That is, under monopolistic market, there is a wide range of close substitutes available for the good whereas, in monopoly market, the monopolist is the single seller and there are no close substitutes available for its product. Due to this, the demand curve under monopoly is less responsiveness to the changes in prices of the good. In contrast to this, in monopolistic market, due to the availability of a wide range of substitutes, there is a higher responsiveness of demand to the changes in prices. Hence, we can infer that the demand curve under monopolistic competition is more elastic than under monopoly.
Question 6 (i) Explain the indeterminate demand curve of an oligopolist.
Ans: Firm's demand curve is indeterminate under oligopoly because there is a high degree of interdependence among the firms. Price and output policy of one firm has a significant impact on the price and output policy of the rival firms in the market. When one firm lowers its price, the rival firms may also lower the price.
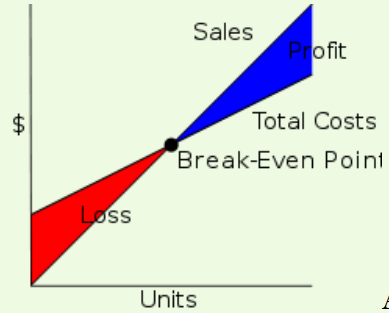
(ii) What is meant by a break-even point? Show it in a diagram.
Ans:
Question 7 (i) How can open market operations help curb deflationary pressure in the economy?
Ans: Aggregate demand is the AD curve and aggregate supply is the AS curve (as shown in the diagram below). While the aggregate demand curve and the aggregate supply curve intersect each other, the full employment equilibrium is attained at Point E. OY is the full employment level of output, and EY is the aggregate demand at full employment level of output. If the aggregate demand decreases below the full employment level of output from EY to CY, then the economy will have deficient demand, i.e. situation of the deflationary gap (EY − CY = EC).
(ii) Indian rupee is a legal tender. Justify this statement.
Ans: 1. Definition of Legal Tender:
Legal tender is any form of money that must be accepted by creditors for the payment of debts when offered in the correct amount.
2. Legal Status of Indian Rupee:
The Reserve Bank of India Act, 1934, explicitly states that all banknotes issued by the Reserve Bank of India (₹2, ₹5, ₹10, ₹20, ₹50, ₹100, ₹200, ₹500, and ₹2000) are legal tender throughout India. Additionally, ₹1 notes issued by the Government of India also hold legal tender status.
Question 8 (i) Describe four important functions of Money.
Ans: Functions of Money are :
- Medium of Exchange : Money serves as a Medium of Exchange and Facilitates the Buying and Selling of Goods, thereby Eliminating the Need for Double Coincidence of Needs and Wants as under Barter.
- Measure of Value : Money has also Removed the Difficulty of Barter System by Serving as a Common Measure of Value. The Values of Various Commodities are Expressed in Terms of Money. Money as a Measure of Value has made Transactions Simple and Easy .
- Standard of Deferred Payments : Money has always been used as a Standard of Deferred Payment . This Function of Money has Attained More Importance in Modern Times with the Extension of Trade based on Credit . As a result of this function, it has become possible to Express Future Payments in Terms of Money.
- Store of Value : Classical Economists did not Recognize the Store of Value Function of Money. Keynes laid Stress on this Function of Money . People Store Money to Meet Unforeseen Contingencies.
(ii) How are deposits created through lending by commercial banks? Explain with the help of a numerical example.
Ans: The process of money creation by the commercial banks starts as soon as people deposit money in their respective bank accounts. After receiving the deposits, as per the central bank guidelines, the commercial banks maintain a portion of total deposits in form of cash reserves. The remaining portion left after maintaining cash reserves of the total deposits is then lend by the commercial bank to the general public in form of credit, loans and advances. Now assuming that all transactions in the economy are routed through the commercial banks, then the money borrowed by the borrowers again comes back to the banks in form of deposits. The commercial banks again keep a portion of the deposits as reserves and lend the rest. The deposit of money by the people in the banks and the subsequent lending of loans by the commercial banks is a never-ending process. It is due to this continuous process that the commercial banks are able to create credit money a multiple times of the initial deposits.
The process of creation of money is explained with the help of the following numerical example.
|
Rounds |
Deposits Received |
Loans Extended |
Cash Reserves |
|
Initial |
10,000 |
8,000 |
2,000 |
|
Ist Round |
8,000 |
6,400 |
1,600 |
|
IInd Round |
6400 |
5,120 |
1,280 |
|
- |
- |
- |
- |
|
nth Round |
- |
- |
- |
|
Total |
50,000 |
40,000 |
10,000 |
Suppose, initially the public deposited Rs 10,000 with the banks. Assuming the Legal Reserve Ratio to be 20%, the banks keep Rs 2,000 as minimum cash reserves and lend the balance amount of Rs 8,000 (Rs 10,000 – Rs 2,000) in form of loans and advances to the general public.
Now, if all the transactions taking place in the economy are routed only through banks then, the money borrowed by the borrowers is again routed back to the banks in form of deposits. Hence, in the second round there is an increment in the deposits with the banks by Rs 8,000 and the total deposits with the banks now rises to Rs 18,000 (that is, Rs 10,000 + Rs 8,000). Now, out of the new deposits of Rs 8,000, the banks will keep 20% as reserves (that is, Rs 1600) and lend the remaining amount (that is, Rs 6,400). Again, this money will come back to the bank and in the third round, the total deposits rises to Rs 24,400 (i.e. Rs 18,000 + Rs 6,400).
The same process continues and with each round the total deposits with the banks increases. However; in every subsequent round the cash reserves diminishes. The process comes to an end when the total cash reserves (aggregate of cash reserves from the subsequent rounds) become equal to the initial deposits of Rs 10,000 that were initially held by the banks. As per the above schedule, with the initial deposits of Rs 10,000, the commercial banks have created money of Rs 50,000.
Question 9 Determine the output and equilibrium level of income with the help of Saving and Investment approach.
Ans: Saving is a function of income, i.e., S = f(Y). Saving is positively related to income so the saving curve is upward sloping. At very low levels of income, saving can be negative. This is because at low levels of income, consumption can be more than income and there can be dissaving in the economy. We will consider the investment to be autonomous, and thus, the investment curve is a horizontal line parallel to the x-axis.
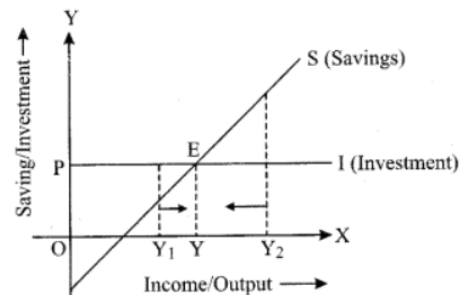
In the diagram, point E is the equilibrium point where S = I. At this point, the amount of money withdrawn from the economy is equal to the amount of money injected into the economy. At this level AD = AS in the economy.
SECTION C – 32 MARKS
Question 10 (i) Explain the Law of Variable Proportions with the help of a diagram.
Ans: Law of Variable proportion:
Law of Variable Proportions (LVP) states that as we increase the quantity of only one input keeping other inputs fixed, total product (TP) initially increases at an increasing rate, then at a decreasing rate and finally at a negative rate.
In the given diagram, the quantity of the variable factor has been measured on X-axis and Y-axis measures the total product on Y-axis. The diagram indicates, how the total product and marginal product changes as a result of increases in the quantity of one factor to a fixed quantity of other factors.
The law can be better explained through three stages -
(a) First stage : Increasing Return to a Factor: In the first stage, every additional variable factor adds more and more to the total output. It means TP increases at an increasing rate and MP of each variable factor rises. Better utilization of fixed factors and increases in the efficiency of a variable factor due to specialization are the major factors responsible for increasing returns. The increasing returns to a factor stage have been shown in the given diagram between O to P. It implies. TP increases at an increasing rate (till point ‘P’) and MP rises till it reaches its maximum point ‘K’. which marks the end of the first phase.
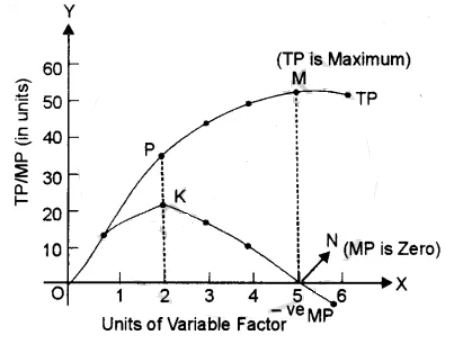
(b) Second stage:
Diminishing returns to a Factor: In the second stage, every additional variable factor adds a lesser and lesser amount of output. It means TP increases at a diminishing rate and MP falls with an increase in a variable factor. The breaking of the optimum combination of a fixed and variable factor is the major factor responsible for diminishing returns. The second stage ends at point ‘S’ when MP is zero and TP is maximum (point ‘M’).
2 stage is very crucial as a rational producer will always aim to produce in this phase because TP is maximum and MP of each variable factor is positive.
(c) Third stage:
Negative Returns to a Factor: In the third stage the employment of additional variable factors causes TP to decline. MP now becomes negative. Therefore, this stage is known as negative returns to a factor. Poor coordination between variable and fixed factor is the basic cause for this stage. In fig. the third stage starts after point ‘N’ on the MP curve and point’ on the TP curve. MP of each variable factor is negative in the 3 stages. So, no firm would deliberately choose to operate in this stage.
(ii) Negative returns cause losses to a firm. What are the causes for Negative returns?
Ans: Causes of negative returns are :
1. Overcrowding: As it rises public sector spending drives down or even eliminates private sector spending.
2. Management problem: It means a problem as a cause, or potential cause, of one or more incidents that affect the production.
3. High expenses: Excessive spending on administrative costs, research & development, or marketing can eat into profits, leading to negative returns.
Question 11
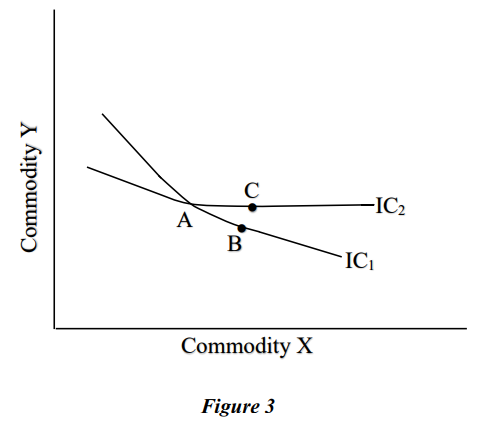
(a) Explain how DMRS is responsible for convexity of Indifference Curve.
Ans: 1. Indifference Curve: This represents combinations of two goods (X and Y) that yield the same level of satisfaction to a consumer. It depicts the trade-off between the goods, showing how much of one a consumer is willing to give up for more of the other while maintaining the same level of satisfaction.
2. Marginal Rate of Substitution (MRS): This measures the rate at which a consumer is willing to trade one good for another while maintaining the same level of satisfaction. Essentially, it tells you how much of Good Y a consumer is willing to give up to get one more unit of Good X (and vice versa).
3. Diminishing Marginal Rate of Substitution (DMRS): This principle states that as a consumer consumes more of one good, the additional satisfaction gained from consuming another good starts to decrease. In other words, the more you have of something, the less additional joy you get from another unit of it compared to something new.
Question 12 (i) What is the difference between Real GDP and Nominal GDP?
Ans: Real GDP vs. Nominal GDP: Understanding Economic Growth with Apples and Oranges Imagine a fruit stand selling only apples.
Real GDP: This considers the volume of apples sold, adjusted for inflation. If in 2022, 100 apples also cost $1 each, then the real GDP in both years would be the same (100 apples), even though the nominal GDP changed due to potential inflation.
Nominal GDP: This would be the total value of apples sold at current prices. Let's say in 2023, they sold 100 apples at $1 each, resulting in a nominal GDP of $100.
(ii) Why are transfer incomes and windfall gains not included in the calculation of national income?
Ans: Transfer income is not included in national income because it is not connected with any productive activity and there is no value addition.
Question 13 Read the passage given below and answer the questions that follow.
India’s overall exports (Merchandise and Services combined) in April-December 2022 was estimated to exhibit a positive growth of 16·11 % over the same period last year. As India’s domestic demand has remained steady amidst the global slump, overall imports were estimated to exhibit a growth of 25·55%. Global growth forecasts indicate a
downturn in global economic activity and trade. The decline in exports is mainly on account of less demand in India’s key destinations – Europe and the US. It may take
some more months for the situation to improve.
In reality, negative growth rates were observed for both exports (Merchandise and Services combined) and imports for this period, but exports exhibited higher negative
growth rate than that of imports.
Source (edited): INDIA’S FOREIGN TRADE: December 2022
Posted on: 16 January 2023 by PIB Delhi
(i) Which account of BOP is the concern in this extract?
Ans: Current account
(ii) Mention the components of this account of BOP.
Ans: Current Account:
- Exports (Merchandise and Services combined): This refers to the value of goods and services sold by India to other countries. The text mentions that this was expected to have positive growth, but in reality, it declined.
- Imports: This refers to the value of goods and services purchased by India from other countries. The text mentions that this was expected to grow, and it did, but at a slower rate than exports.
(iii) Which situation, deficit or surplus, of this account is focused here?
Ans: Trade deficit.
(iv) Which policy measure, revaluation or devaluation should be implemented to resolve the situation given above? Explain the mechanism in brief.
Ans: Devaluation:
- Mechanism: Devaluing the Indian rupee makes Indian exports relatively cheaper by increasing their price in foreign currencies. This makes them more attractive to foreign buyers, potentially boosting demand and increasing export volume.
- Applicability: Given the declining export figures and a negative growth rate compared to imports, the situation suggests declining competitiveness of Indian exports. Devaluation can address this directly by making them cheaper and increasing demand.
Revaluation:
- Mechanism: Revaluing the rupee strengthens its value compared to foreign currencies, making Indian exports relatively more expensive in foreign markets. This could further decrease demand and worsen the already declining export performance.
- Applicability: Given the current scenario, revaluation would be counterproductive as it directly undermines the competitiveness of Indian exports.
(v) How does this account of BOP influence the national income?
Ans: Understanding the Impact of the Account on National Income
While the provided account offers valuable information about India's trade performance, it lacks specific details about the magnitude of negative growth rates in exports and imports, making a precise assessment of its impact on national income difficult. However, based on the general trends described, here's what we can understand:
Negative impact on net exports:
- Direct impact: Both exports and imports contribute to national income, but net exports (exports minus imports) play a crucial role. Since exports declined more than imports, we can expect a negative impact on net exports, and consequently, national income.
-


 Quiz
Quiz


