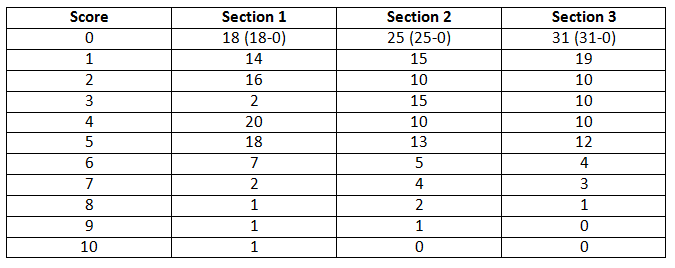
A score is shown in the left column and the number of test-takers who have scored less then that marks is shown in the right column and individual score of each column is an integer.
Hence we can draw a table for the number of test-takers who have scored exact marks.
In section 1 test-takers who scored exact 0=18
Similarly test-takers who scored exact 1 = 32-18=14
We can create a following table on the basis of the given data.
It is given that the test-takers are arranged in descending order of their scores in one section, then the same arrangement would occur in the other two sections also. This means that the student who is ranked 51st in section 1 will also be ranked 51st for the other two sections also
and this will be true for all the other students.
If we rank the students according to their marks then we can say that
Students with ranks from 83 to 100 have scored 0 in all three sections so their overall score is also 0.
Students with ranks from 76 to 82 have scored 1 in section 1 and 0 in the rest of the sections so their overall score is 1.
Students with ranks from 70 to 75 have scored 1 in both section 1 and section 2 and 0 in section 3 so their overall score is 2.
Students with rank 69 have scored 1 in all three sections so their overall score is 3.
Students with ranks from 61 to 68 have scored 2 in section 1 and 1 in the other two sections so their overall score is 4.
Students with ranks from 53 to 60 have scored 2 in sections 1 and 2 and 1 in section 3 so their overall score is 5.
Students with ranks from 51 to 52 have scored 2 in all three sections so their overall score is 6.
Student ranked 50 scored a total of 4 in section 1, 3 in section 2, and 2 in section 1 => overall score is 9. Students whose ranks are 1 - 49 will have scored greater than or equal to 9. => => This is the minimum score of someone who cleared the cutoff.


 ×
×


 Sign in
 Profile
 Signout