


 Sign in
 Profile
 Signout
Karnataka 2nd PUC (12th) Exam 2024 : Economics Important Question Answers


Karnataka 12th exams are going on and your Economics paper is on 15th March 2024. You have only a few hours left for the Economics exam.
As the Karnataka Board 2nd PUC Exam 2024 approaches, students preparing for the Economics paper often find themselves looking for a comprehensive resource that throws light on important questions.
In this, every important question has been sorted and collected, which is very important for your paper, so that the student can score good marks in less time. Answers to all the questions are given together.
For this we have compiled a detailed guide that breaks down important topics, provides important questions for each chapter, and aligns them with the marking scheme.
Karnataka 2nd PUC (12th) Economics Important Question Answers
PART - A
I. Choose the correct answer (Each question carries 1 mark).
1. The scare resources of an economy have
(a) Competing usages
(b) Unlimited usages
(c) Single Usages
(d) None of the above
Ans. (a) Competing usages
2. The equation of budget line is
(a) Px+p1x1 = M
(b) M = Poxo+Px
(c) P1x1+P2x2 = M
(d) Y = Mx+C
Ans. (c) P1x1+P2x2 = M
3. In a capitalist country production activities are mainly carried out by
(a) Private enterprises
(b) Government authority
(c) Planning authority
(d) None of the above
Ans. (a) Private enterprises
4. NNP= GNP -
(a) Deduction
(b) Depreciation
(c) Investment
(d) None of the above
Ans. (b) Depreciation
5. Value of MPC lies between
(a) 1 and 2
(b) 0 and 1
(c) 2 and 4
(d) 0 and 0.5
Ans. (b) 0 and 1
II. Fill in the blanks by choosing correct answer from the bracket. (Each question Carries 1 mark.)
(Stock, Narrow money, Variables, Shutdown Point, Revenue receipts, minimum point p)
6. In the long run all inputs are _____________
7. The point of minimum AVC where the SMC curves cuts the AVC curves is called ____________
8. ___________ are define at a particular point of time.
9. M1 and M2 are known as _____________
10. Revenue deficit = Revenue expenditure - _______________
Ans. 6. variables, 7. shutdown point, 8. Stocks, 9. narrow money, 10. revenue receipts.
III. Match the following (Each question Carries 1 mark)
A B
11. Service of teacher (a) Repo
12. Market equilibrium (b) Trade in goods
13. AR= (c) Skill
14. Repurchase agreement (d) TR/Q
15. Balance of Trade (e) QD=QS
(f) Labour
Ans. 11. (c) Skill, 12. (e) QD=QS, 13. (d) TR/Q, 14. (a) Repo, 15. (b) Trade in goods
IV. Answer the following questions in a sentence or a word (Each question carries 1 mark)
16. Give the meaning of marginal product.
Ans. Marginal product refers to the additional output produced by using one more unit of input, while keeping other inputs constant.
17. What is price ceiling ?
Ans. A price ceiling is a maximum price set by a government or other authority above which prices cannot legally rise in a particular market.
18. Give the meaning intermediate goods.
Ans. Intermediate goods are products that are used as inputs in the production process of other goods or services.
19. Write themeaning of autonomous consumption.
Ans. Autonomous consumption refers to the level of consumption expenditure that occurs even when disposable income is zero.
20. Who are the free riders ?
Ans. Free riders are individuals or entities that benefit from a public good without contributing to its production or cost.
PART- B
V. Answer any Six of the following in 4 sentences each (Each question carries 2 marks)
21. What is price elasticity of demand ? Write the formula.
Ans. This measures how responsive the quantity demanded of a good is to a change in its price. It's calculated as the percentage change in quantity demanded divided by the percentage change in price. (Formula: PED = (% change in Quantity Demanded) / (% change in Price))
22. What do you mean by inferior goods ? Give example.
Ans. Inferior goods refer to those goods whose demand decreases with an increase in income. For example, if the demand for "jaggery" decreases with an increase in income, then "jaggery" is an inferior good.
23. Mention the conditions needed for profit by a firm under perfect competition.
Ans. For a firm to make a profit under perfect competition, it must meet certain conditions, including producing at the quantity where marginal cost equals marginal revenue, selling goods at a price higher than average total cost, and operating in a market with no barriers to entry or exit.
24. Define equilibrium price and quantity.
Ans. Equilibrium price is the price at which the quantity demanded by consumers equals the quantity supplied by producers in a market. Equilibrium quantity is the quantity of goods or services bought and sold at the equilibrium price.
25. Distinguish between excess demand and excess supply.
Ans. Excess demand occurs when the quantity demanded exceeds the quantity supplied at a given price, leading to shortages. Excess supply occurs when the quantity supplied exceeds the quantity demanded at a given price, resulting in surpluses.
26. Mention 3 methods of measuring GDP(National income).
Ans. Three methods of measuring GDP (National income) are the production approach, where GDP is calculated by adding up the value of all goods and services produced; the income approach, where GDP is calculated by adding up all incomes earned; and the expenditure approach, where GDP is calculated by adding up all spending on final goods and services.
Karnataka 2nd PUC Supplementary Study Material
| Karnataka 2nd PUC Supplementary Study Material Free | |
| Karnataka 2nd PUC Previous Year Question Papers | Karnataka 2nd PUC Question Bank |
| Karnataka 2nd PUC Model Paper | Karnataka 2nd PUC Textbooks |
| Karnataka 2nd PUC Syllabus | |
27. Write the equation of GDPMP and GDPFC.
Ans. GDPMP (Gross Domestic Product at Market Prices) is calculated by adding up the total market value of all final goods and services produced in a country during a specific period. GDPFC (Gross Domestic Product at Factor Cost) is calculated by subtracting indirect taxes and adding subsidies from GDPMP.
28. Give the meaning of Paradox of thrift.
Ans. The paradox of thrift refers to the situation where an increase in saving leads to a decrease in overall spending and can result in lower economic growth. While saving is generally seen as a positive individual behavior, if everyone saves more and reduces their spending, it can lead to decreased demand and economic slowdown.
29. Why the proportional income tax acts as automatic stabilizer ?
Ans. Proportional income tax acts as an automatic stabilizer because it reduces disposable income as income increases. This helps stabilize aggregate demand as individuals pay a higher percentage of their income in taxes when they earn more, reducing the potential for inflation during periods of economic expansion.
30. Why do people demand foreign exchange ?
Ans. People demand foreign exchange for various reasons, such as importing goods and services, traveling abroad, investing in foreign assets, or repatriating profits earned from overseas investments. The demand for foreign exchange is driven by international trade, investment opportunities, and currency exchange rates.
PART - C
VI. Answer any five of the following question in 12 sentences each. (Each question carries 4 marks)
31. Write a note on market economy.
Ans. A market economy is an economic system characterized by the decentralized allocation of resources and the predominance of market forces in determining prices, production, and consumption decisions. In a market economy, the forces of supply and demand play a crucial role in shaping the allocation of goods and services. Here are key aspects of a market economy :
1. Private Ownership : In a market economy, most resources and means of production are owned and controlled by private individuals or entities. This includes private businesses, households, and entrepreneurs who make decisions based on profit motives and individual preferences.
2. Price Mechanism : The price mechanism, determined by the interaction of supply and demand in the market, serves as a signaling system. Prices reflect the relative scarcity of goods and services, guiding producers and consumers in their decisions. For example, when demand increases, prices tend to rise, signaling producers to increase production to meet the higher demand.
3. Competition : Market economies are characterized by competitive markets where multiple producers and sellers operate. Competition fosters efficiency, innovation, and responsiveness to consumer preferences. It incentivizes firms to improve quality, reduce costs, and introduce new products to gain a competitive edge.
4. Consumer Choice : Consumers in a market economy have the freedom to choose among a variety of goods and services based on their preferences, budget constraints, and utility. This freedom of choice drives producers to cater to diverse consumer demands, leading to product differentiation and specialization.
5. Profit Motive : The pursuit of profit is a fundamental driver in a market economy. Businesses aim to maximize profits by optimizing production processes, managing costs, and identifying profitable market opportunities. Profit incentives encourage entrepreneurship, investment, and economic growth.
6. Limited Government Intervention : Unlike planned economies where the government plays a central role in resource allocation, market economies typically have minimal government interference in economic activities. Governments in market economies primarily focus on enforcing property rights, ensuring fair competition, and providing public goods and services.
7. Flexibility and Adaptability : Market economies are known for their flexibility and adaptability to changing economic conditions. Prices and quantities adjust dynamically in response to shifts in supply and demand, allowing the economy to adjust to shocks, technological advancements, and changes in consumer preferences.
Overall, a market economy emphasizes individual freedom, competition, efficiency, and innovation. While it offers opportunities for growth and prosperity, it also faces challenges such as income inequality, market failures, and externalities, which may require regulatory measures and government interventions to address.
32. Write the differences between total utility and marginal utility.
Ans. Differences between Total Utility and Marginal Utility :-
1. Meaning : Total Utility refers to the overall satisfaction a consumer derives from the consumption of goods or services. On the other hand, Marginal Utility quantifies the satisfaction gained from the consumption of additional units of a good or service.
2. Rate of Increase : Total Utility increases as more consumption is done. However, Marginal Utility diminishes with an increase in total utility.
3. Result : Total Utility suffers from diminishing returns. In contrast, Marginal Utility reduces with the consumption of each additional unit.
4. Definition : Total Utility is the sum of marginal utilities of all individual items. Marginal Utility, however, is the additional satisfaction received by a consumer on the consumption of an extra unit of a commodity.
33. Explain isoquant with the help of the diagram.
Ans. An isoquant is a curve that represents all the combinations of two inputs (commonly capital and labor) that result in the same level of output. It is a tool used in microeconomics to understand the influence of inputs on the obtainable level of output or production. 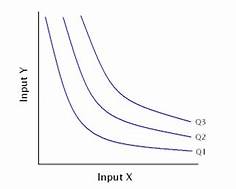
Here’s a simplified explanation of an isoquant with the help of a diagram :
1. Shape : An isoquant curve is typically concave due to the law of diminishing returns. This law states that after some optimal level of production capacity is reached, adding other factors will actually result in smaller increases in output.
2. Position : Higher isoquants represent higher levels of output. Therefore, a shift of an isoquant curve to a higher position indicates growth in the size of a firm.
3. Slope : The slope of the isoquant curve shows the rate at which a given input, either labor or capital, can be substituted for the other while keeping the same output level. For example, if a firm moves down from point (a) to point (b) on the curve and uses one additional unit of labor, it can give up four units of capital and yet remain on the same isoquant at point (b).
4. Interpretation : The isoquant curve assists companies and businesses in making adjustments to their manufacturing operations, to produce the most goods at the most minimal cost.
In conclusion, an isoquant curve is a valuable tool in microeconomics that helps visualize the trade-off between different inputs while maintaining the same level of output.
34. Write a table to show the impact of simultaneous on equilibrium
Ans. To illustrate the impact of simultaneous changes on equilibrium, we can create a table that demonstrates how changes in supply and demand affect the equilibrium price and quantity in a hypothetical market. Let's assume we're analyzing the market for smartphones, and we'll consider changes in both supply and demand simultaneously.
Here's a table showing the impact of simultaneous changes on equilibrium: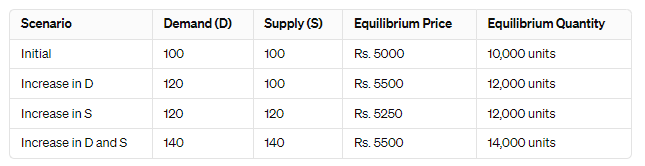 Explanation of each scenario:
-
Initial Equilibrium:
- Demand: 100 units at Rs. 5000 per unit
- Supply: 100 units at Rs. 5000 per unit
- Equilibrium Price: Rs. 5000
- Equilibrium Quantity: 10,000 units
-
Increase in Demand:
- Demand increases to 120 units while supply remains at 100 units
- Equilibrium Price rises to Rs. 5500
- Equilibrium Quantity increases to 12,000 units
-
Increase in Supply:
- Supply increases to 120 units while demand remains at 100 units
- Equilibrium Price falls to Rs. 5250
- Equilibrium Quantity remains at 12,000 units
-
Increase in Both Demand and Supply:
- Both demand and supply increase to 140 units
- Equilibrium Price remains at Rs. 5500
- Equilibrium Quantity increases to 14,000 units
This table demonstrates the impact of simultaneous changes in demand and supply on the market equilibrium. When both demand and supply increase, the equilibrium quantity increases, but the impact on price depends on the magnitude of the changes in supply and demand.
35. Briefly explain in what way macro-economics is different from micro-economics.
Ans. Macroeconomics and microeconomics are two branches of economics that focus on different levels of analysis and deal with distinct economic phenomena. Here are the key differences between macroeconomics and microeconomics :
-
Scope of Analysis :
- Microeconomics : Microeconomics deals with individual economic agents such as households, firms, and industries. It focuses on understanding the behavior of these units in decision-making processes related to resource allocation, production, consumption, pricing, and market interactions. Microeconomics examines specific markets, such as the market for goods and services, labor market, and financial markets, to analyze how individuals and firms make choices and how these choices impact resource allocation and market outcomes.
- Macroeconomics : Macroeconomics, on the other hand, examines the economy as a whole. It studies aggregate variables such as national income, output, employment, inflation, economic growth, and overall economic performance. Macroeconomics analyzes the interactions among major economic sectors (consumption, investment, government spending, and net exports), government policies, monetary systems, and international trade to understand and explain the broader economic phenomena and trends at the national or global level.
-
Focus of Analysis :
- Microeconomics : Microeconomics focuses on the behavior of individual economic units and how their decisions impact market outcomes, prices, quantities, and resource allocation. It delves into concepts like demand and supply, consumer behavior, producer behavior, market structures (perfect competition, monopoly, oligopoly, monopolistic competition), price determination, production costs, efficiency, and market failures.
- Macroeconomics : Macroeconomics focuses on the overall performance and functioning of the entire economy. It examines issues related to aggregate demand and aggregate supply, economic fluctuations (business cycles), unemployment, inflation, fiscal policy (government spending and taxation), monetary policy (money supply, interest rates), economic stabilization, international trade, exchange rates, and economic growth. Macroeconomics also addresses long-term economic trends, structural changes, and policy implications for economic stability and growth.
-
Policy Implications :
- Microeconomics : Microeconomics is often used to inform specific policies and decisions at the individual or firm level. It helps policymakers understand market behaviors, market failures, and interventions that can improve market outcomes, promote competition, protect consumer interests, regulate industries, address externalities, and ensure efficient resource allocation within specific markets.
- Macroeconomics : Macroeconomics plays a crucial role in shaping economic policies and strategies at the national or international level. It guides policymakers in managing overall economic performance, stabilizing the economy during periods of recession or inflation, achieving full employment, controlling inflationary pressures, fostering economic growth, managing fiscal deficits and public debt, formulating monetary policies, and addressing global economic challenges and imbalances.
In summary, microeconomics focuses on individual economic units and specific markets, while macroeconomics analyzes the entire economy and addresses broader economic issues, policies, and trends at the national or global level. Both branches of economics provide valuable insights into different aspects of economic behavior and help inform policy decisions to achieve desirable economic outcomes.
36. Write a note on externalities.
Ans. Externalities are a significant concept in economics that refer to the unintended side effects or consequences of economic activities that affect third parties who are not directly involved in the activity. These effects can be either positive or negative and often occur when the actions of producers or consumers have an impact on individuals or entities outside the market transaction.
37. Briefly explain the functions of RBI.
Ans. The Reserve Bank of India (RBI) plays a crucial role in the Indian economy by performing various functions that contribute to the stability, efficiency, and development of the financial system. Here are the key functions of RBI :
-
Monetary Authority :
- The RBI acts as the central bank of India and is responsible for formulating and implementing monetary policies. It manages the money supply, interest rates, and credit conditions in the economy to achieve macroeconomic objectives such as price stability, economic growth, and full employment.
- Through monetary policy tools like open market operations, repo rate adjustments, and reserve requirements, the RBI influences the availability of credit, inflation rates, investment levels, and overall economic activity.
-
Regulator of Banks and Financial Institutions :
- The RBI regulates and supervises banks, financial institutions, and non-banking financial companies (NBFCs) to ensure their stability, solvency, and compliance with regulatory norms.
- It sets prudential regulations, capital adequacy requirements, and risk management guidelines for banks and financial institutions to maintain a sound and healthy banking system.
-
Currency Issuance and Management :
- As the sole authority for issuing currency notes and coins in India, the RBI manages currency circulation, distribution, and maintenance of the country's currency supply.
- It ensures the availability of an adequate supply of currency to meet the transactional needs of the economy while safeguarding against counterfeiting and maintaining currency integrity.
-
Banker to the Government :
- The RBI acts as the banker and fiscal agent to the central and state governments, managing their banking transactions, government securities issuance, and public debt management.
- It facilitates government borrowing, manages cash balances, executes government payments and receipts, and provides advisory services on fiscal matters.
-
Foreign Exchange Management :
- The RBI regulates and manages the foreign exchange market in India, overseeing foreign exchange transactions, exchange rate policies, and foreign currency reserves.
- It formulates and implements policies to promote exchange rate stability, facilitate external trade and payments, manage capital flows, and safeguard foreign exchange reserves.
-
Developmental Functions :
- In addition to its regulatory and monetary roles, the RBI performs developmental functions aimed at promoting financial inclusion, enhancing financial literacy, and supporting economic development initiatives.
- It undertakes initiatives to deepen financial markets, improve payment and settlement systems, foster innovation in banking and finance, and promote inclusive growth through targeted policies and programs.
Overall, the functions of the RBI are integral to maintaining financial stability, ensuring monetary policy effectiveness, fostering a robust banking system, and supporting sustainable economic growth in India.
38. Briefly explain consumption function
Ans. The consumption function is a concept in economics that describes the relationship between consumer spending and disposable income. It is a fundamental component of Keynesian economics and helps to understand how changes in income affect consumer behavior and aggregate demand. Here are key points about the consumption function :
Ans. The current account is one of the main components of a country's balance of payments, which records all international transactions made by residents of the country with the rest of the world. The current account consists of several sub-components that capture different types of transactions. Here is the chart of components of the current account :
-
Trade Balance :
- Exports of Goods : The value of goods (tangible products) exported by the country to foreign markets.
- Imports of Goods : The value of goods (tangible products) imported into the country from foreign markets.
- Trade Balance : The difference between exports and imports of goods, also known as the trade surplus (if exports exceed imports) or trade deficit (if imports exceed exports).
-
Services :
- Exports of Services : The value of services (intangible products) provided by residents of the country to foreign entities, such as transportation, tourism, financial services, and consulting.
- Imports of Services : The value of services (intangible products) received by residents of the country from foreign entities.
-
Income :
- Primary Income : Income earned by residents of the country from investments abroad, including wages, profits, dividends, and interest.
- Secondary Income : Transfers of money between residents and non-residents, such as foreign aid, remittances, and gifts.
-
Current Transfers :
- Current Transfers : Includes unilateral transfers of money or goods between residents and non-residents without receiving anything in return. This includes foreign aid, remittances, grants, and donations.
-
Balance of Current Account :
- Balance of Current Account : The overall balance of the current account, which is the sum of the trade balance, services balance, income balance, and current transfers balance. It indicates whether a country is a net lender or net borrower in international transactions during a specific period.
Here is the chart summarizing the components of the current account :
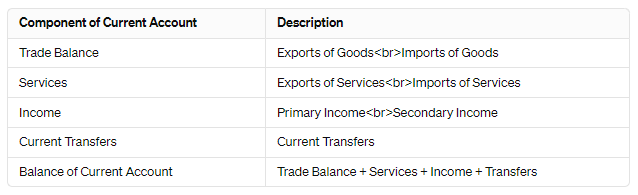
Understanding the components of the current account is crucial for analyzing a country's international trade, financial flows, and overall economic health in terms of its external transactions with the rest of the world.
PART - D
VII. Answer any three of the following question in 20 sentences each. (Each question carries 6 marks)
40. Explain the law of diminishing marginal utility with the help of a table and diagram.
Ans. Law of Diminishing Marginal Utility :
The law of diminishing marginal utility states that as a consumer consumes more units of a good or service, the additional satisfaction (marginal utility) gained from each additional unit generally decreases. In simpler terms, the more you consume something, the less additional satisfaction you get from each extra unit.
Table :
| Units Consumed (X) | Total Utility (TU) | Marginal Utility (MU) |
|---|---|---|
| 1 | 10 | 10 |
| 2 | 18 | 8 |
| 3 | 24 | 6 |
| 4 | 28 | 4 |
| 5 | 30 | 2 |
Explanation of the Table:
- Units Consumed (X): This column represents the number of units consumed by the consumer.
- Total Utility (TU): This column represents the total satisfaction the consumer receives from consuming X units. As the number of units consumed increases, the total utility generally increases. However, the rate of increase slows down over time.
- Marginal Utility (MU): This column represents the additional satisfaction gained from consuming one more unit (the difference in TU between consecutive rows). As you can see, the marginal utility decreases with each additional unit consumed.
Diagram :
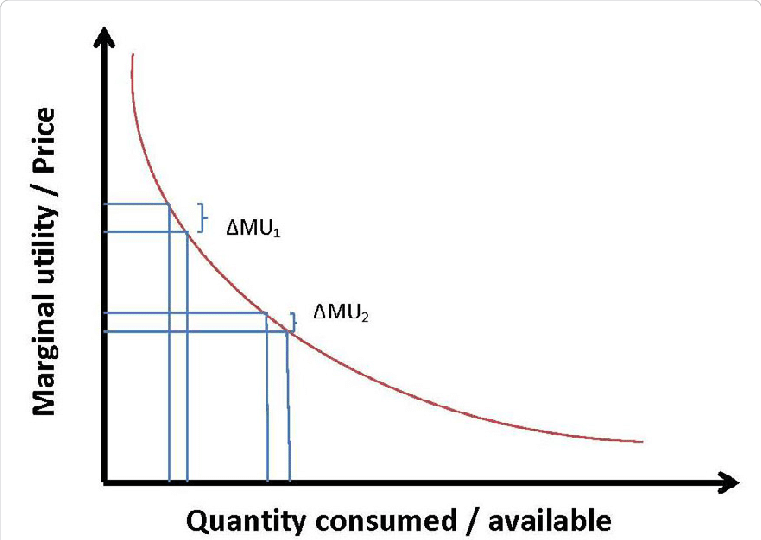
The diagram shows a curve that slopes downwards from left to right. This represents the diminishing marginal utility concept. Initially, the curve rises sharply, indicating a significant increase in satisfaction with each additional unit. However, as consumption continues, the curve flattens out, signifying a smaller increase in satisfaction with each extra unit.
Key Points:
- This law doesn't imply total satisfaction ever becomes negative. You might still enjoy consuming the good or service, but the additional enjoyment you get from each extra unit gets smaller.
- The rate of diminishing marginal utility can vary depending on the good or service being consumed. Some goods might have a faster decline in marginal utility compared to others.
This explanation, along with the table and diagram, provides a comprehensive understanding of the law of diminishing marginal utility.
41. Explain market supply curve with the help of diagram.
Ans. Market Supply Curve Explained with Diagram :-
The market supply curve depicts the relationship between the price of a good or service and the total quantity that all firms in a market are willing and able to sell at that specific price. It's a graphical representation of how much suppliers are willing to offer at different price points.
Key Characteristics :
- Upward Slope : Generally, the market supply curve slopes upwards. This indicates that as the price of a good or service increases:
- Existing firms are incentivized to produce more due to higher potential profits.
- Existing firms might be able to increase their output by employing more resources or using more efficient production methods.
- New firms might be attracted to enter the market, further increasing the total quantity supplied.
Factors Affecting Market Supply :
- Input Prices : If the cost of raw materials, labor, or other production inputs increases, firms might be less willing to supply at the same price level, potentially shifting the curve upwards.
- Technology : Advancements in technology that reduce production costs can lead to an increase in the quantity supplied at each price point, shifting the curve downwards.
- Number of Sellers : A greater number of firms in the market can lead to a higher quantity supplied at each price level, shifting the curve to the right.
- Government Regulations : Government policies such as subsidies or taxes can influence production costs and supplier decisions, potentially shifting the curve.
- Expectations of Future Prices : If firms anticipate future price increases, they might be willing to hold onto some inventory, leading to a decrease in current supply (leftward shift).
Diagram :
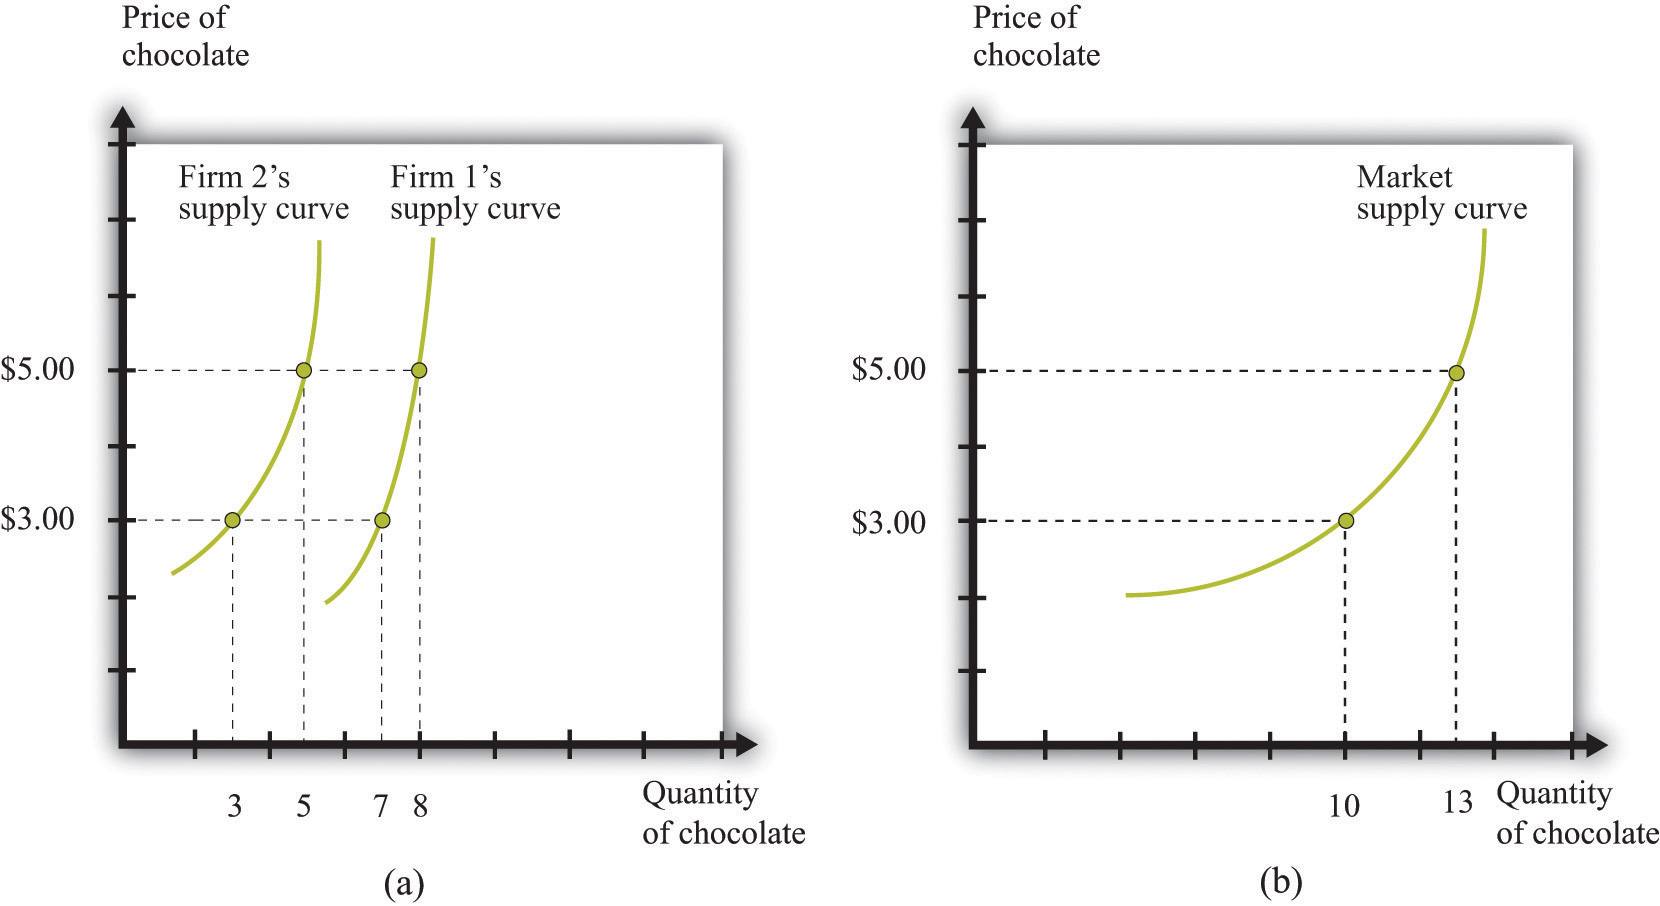 The x-axis represents the quantity supplied (Q), which is the total amount of the good or service that all firms in the market are willing to sell. The y-axis represents the price (P) of the good or service. The upward slope signifies that as the price increases, the quantity supplied also increases.
By understanding the market supply curve, you can analyze how changes in various factors can influence the availability of a good or service in the market and how it interacts with the demand curve to determine the equilibrium price and quantity.
42. Explain the macroeconomic identities
Ans. The macroeconomic identities are as follows:
1. Gross domestic product (GDP): Gross domestic product measures the aggregate production of final goods and services taking place within the domestic economy during a year. But the whole of it may not accrue to the citizens of the country. It includes GDP at market prices and GDP at factor cost.
GDP at market price is the market value of all final goods and services produced within a domestic territory of a country measured in a year. Here everything is valued at market prices. It is obtained as follows:
GDPMP = C + I + G + X – M
GDP at factor cost is gross domestic product at market prices minus net indirect taxes. It measures money value of output produced by the firms within the domestic boundaries of a country in a year.
GDPFC = GDPMP – NIT.
2. Gross national product: It refers to all the economic output produced by a nation’s normal residents, whether they are located within the national boundary or abroad. It is defined as GDP plus factor income earned by the domestic factors of production employed in the rest of the world minus factor income earned by the factors of production of the rest of the world employed in the domestic economy. Therefore,
GNP = GDP + Net factor income from abroad.
3. Net national product (NNP): A part of the capital gets consumed during the year due to wear and tear. This wear and tear is called depreciation. If we deduct depreciation from GNP the measure of aggregate income that we obtain is called net national product. We get the value of NNP evaluated at market prices.
So, NNP = GNP – Depreciation.
4. Net national product (NNP) at factor cost: The NNP at factor is the sum of income earned by all factors in the production in the form of wages, profits, rent, and interest, etc. belong to a country during a year. It is also known as national income. We need to add subsidies to NNP and deduct indirect taxes from NNP to obtain NNP at factor cost.
NNPFC = NNP at market prices – indirect taxes + subsidies
5. Personal income (PI): It refers to the part of national income (NI) which is received by households. It is obtained as follows: PI = NI – Undistributed Profits -Net interest payments made by the households – Corporate tax + Transfer payments to the households from the government and firms.
6. Personal disposable income (PDI): If we deduct the personal tax payments (income tax) and non-tax payments (fines, fees) from personal income, we get PDI. Therefore,
PDI = PI – Personal tax payments – Non-tax payments.
43. Explain the functions of money. How does money over come the short comings of a barter system ? Mention.
Ans. The functions of money are broadly classified as follows:
I. Primary functions: The primary functions of money are as follows:
a. Medium of exchange: Money plays an important role as a medium of exchange. It facilitates exchange of goods for money. It has solved the problems of barter system. Barter exchanges become extremely difficult in a large economy because of the high costs people would have to incur looking for’suitable persons to exchange their surpluses. It helps the people to sell in one place and buy-in another place. Money has widened the scope of market transactions. Money has become a circulating material between buyers and sellers.
b. Measure of value/unit of account: The money acts as a common measure of value. The values of all goods and services can be expressed in terms of money.
As a measure of value, money performs following functions:
1. The value of all goods and services measured and expressed in terms of the money
2. Rate of exchange of goods and services expressed in money
3. Facilitates the maintenance of accounts
4. It facilitates price mechanism
5. It makes goods and services comparable in terms of price.
For instance, when we say that the value of a book is Rs.500 we mean that the book can be exchanged for 500 units of money where a unit of money is rupee in this case. If the price of a pencil is Rs.5 and that of a pen is Rs.10 we can calculate the relative price of a pen with respect to a pencil, i.e. a pen is worth 10/5=2 pencils.
II. Secondary functions: The secondary functions of money are as follows:
a. Store of value: People can save part of their present income and hold the same for future. Money can be stored for precautionary motives needed to overcome financial stringencies. Money solves one of the deficiencies of barter system, i.e. difficulty to cany forward one’s wealth under the barter system.
For instance, we have an endowment of wheat which we do not wish to consume today entirely. We may regard this stock of surplus wheat as an asset which we may wish to consume or even sell-off”, for acquiring other commodities at some future date. But wheat is a perishable item and cannot be stored beyond a certain period.
Also, holding the stock of rice required a lot of space. We may have to spend considerable time and resources looking for people with a demand for wheat when we wish to exchange our stock for buying other commodities. This problem can be solved if we sell our wheat for money. Money is not perishable land its storage costs are also less.
b. Standard of deferred payments: All the credit transactions are expressed in terms of money. The payment can be delayed or postponed. So, money can be used for delayed settlement of dues or financial commitments.
c. Transfer of value: Money acts as a transfer of value from person to person and from place to place. As a transfer of value, money helps us to buy goods, properties or anything from any part of the country or the world. Further, money earned in different places can be brought or transferred to anywhere in the world.
III. Contingent functions of money: Other than primary and secondary functions, money also performs other functions which are as follows:
a. Basis of credit: Money serves as a basis of the credit. The modem credit system exists only because of existence of money.
b. Distribution of national income: Money helps in distribution of national income. The reward paid to factors of production in the form of rent, wages, interest, and profit are nothing but the distribution of national income at factor prices.
c. Provides liquidity and uniformity: Money provides liquidity to all kinds of assets both moveable and immovable. Money can be converted into any type of asset and all assets can be converted into money.
d. Helps in consumers’ and producers’ equilibrium: All goods and services are expressed in terms of money. The consumer attains equilibrium when the price of a product is equal to his marginal utility. Similarly, the producers reach equilibrium if they get maximum satisfaction. Both consumers and producers try to achieve equilibrium with the help of money.
44. Explain the classification of receipts ?
Ans. Receipts in economics can be classified into various categories based on their nature, source, and purpose within an economic context. Here are the common classifications of receipts:
-
Revenue Receipts:
- Tax Revenue: Receipts generated from direct and indirect taxes imposed by the government on individuals, businesses, and other entities. Examples include income tax, sales tax, excise duty, customs duty, and corporate tax.
- Non-Tax Revenue: Receipts earned by the government from sources other than taxes. This includes fees, fines, penalties, charges for government services, dividends from public sector enterprises, and proceeds from asset sales.
-
Capital Receipts:
- Borrowings: Receipts obtained by the government through borrowing from domestic or foreign sources. It includes loans, bonds, debentures, and other forms of borrowing used to finance capital expenditures or budget deficits.
- Disinvestment Proceeds: Receipts from the sale of government-owned assets such as shares in public sector companies, land, buildings, infrastructure projects, and other investments.
-
External Receipts:
- Foreign Aid: Receipts in the form of grants, loans, or technical assistance provided by foreign governments, international organizations, or donor agencies to support development projects, humanitarian assistance, or policy initiatives.
- Foreign Direct Investment (FDI): Receipts from foreign investors or multinational corporations investing in domestic businesses, industries, infrastructure, or real estate.
- Remittances: Receipts from money transfers sent by individuals working abroad (migrants) to their families or relatives in their home country.
-
Internal Receipts:
- Income from Government-Owned Enterprises: Receipts from profits, dividends, royalties, and other income generated by government-owned or controlled enterprises, utilities, and public sector companies.
- Recoveries and Repayments: Receipts from repayments of loans, advances, grants, or recoveries of dues owed to the government by individuals, businesses, or institutions.
- Interest Earnings: Receipts from interest earned on government investments, securities, deposits, loans, or other financial assets.
-
Current Receipts:
- Current Transfers: Receipts from non-commercial, one-way transfers of money or assets between residents and non-residents without any corresponding exchange of goods or services. This includes gifts, donations, grants, foreign aid, and remittances.
- Net Income from Abroad: Receipts from income earned by residents (individuals, businesses, government) from their investments, assets, or activities in foreign countries, after deducting payments made to foreign entities.
These classifications of receipts are essential for analyzing government finances, international transactions, investment inflows, fiscal policies, and economic activities within an economy. They provide insights into revenue sources, expenditure patterns, financial flows, and overall economic performance.
PART - E
VIII. Answer any two of the following project and assignment oriented questions. (Each question carries 5 marks) (2x5=10)
45. A Consumer wants to consume two goods. The price of Bananas is Rs. 5 and the price of Mangoes is Rs 10. The consumer income is Rs 40.
(a) How much bananas can she consumes if she spends her entire income on that good ?
Ans.
- Income: Rs. 40
- Price of Bananas: Rs. 5 per banana
We can divide the consumer's income by the price of bananas to find out how many bananas she can afford:
Number of bananas = Income / Price per banana
Number of bananas = Rs. 40 / Rs. 5/banana
Number of bananas = 8 bananas
Therefore, the consumer can buy 8 bananas if she spends her entire income (Rs. 40) on bananas.
(b) How much mangoes can she consumes if she spends her entire income on that good ?
Ans. If the consumer spends her entire income on mangoes, which are priced at Rs 10 each, she can purchase :  So, she can consume 4 mangoes. This answer is worth 5 marks as per your grading system.
(c) Is the slope of Budget line downward or upward ?
Ans. The slope of the budget line is downward. This is because the budget line represents the various combinations of two goods (bananas and mangoes) that the consumer can buy with a fixed income. As the consumer purchases more of one good (e.g., bananas), she has to give up some units of the other good (e.g., mangoes), resulting in a negative slope.
(d) Are the bundles on the budget line equal to the consumer's income or not ?
Ans. Yes, the bundles on the budget line are equal to the consumer's income. The budget line represents all possible combinations of goods that the consumer can buy given her income and the prices of the goods. Therefore, any point on the budget line corresponds to spending the entire income on the goods at their respective prices.
(e) If you want to have more of Bananas, You have to give up Mangoes. Is it true ?
Ans. Yes, the statement is true. This is due to the law of diminishing marginal utility, which states that as a consumer consumes more of a good, the additional satisfaction or utility derived from each additional unit decreases. Therefore, to consume more bananas, the consumer must give up some mangoes, as each additional unit of bananas sacrificed for mangoes provides less utility than the previous unit of bananas consumed.


 Quiz
Quiz


