-
Question 1
1 / -0
Directions: Study the given data and answer the following question.
The following table shows the sales (in units) of different chocolates in 6 stores:
| Store | Dairy Milk | 5 Star | Kit Kat |
| Store A | 52 | 26 | 41 |
| Store B | 26 | 42 | 36 |
| Store C | 58 | 19 | 23 |
| Store D | 45 | 32 | 58 |
| Store E | 65 | 45 | 52 |
| Store F | 25 | 34 | 37 |
Which chocolate has the highest average sales?
Solution
Average sales of Dairy Milk =
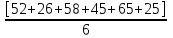
= 45.16
Average sales of 5 Star =
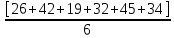
= 33
Average sales of Kit Kat =
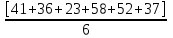
= 41.16
Dairy Milk has the highest average sales.
-
Question 2
1 / -0
Directions: Study the given information and answer the following question.
The table below shows the sales of chocolates of different brands by different stores:
Store
| Dairy Milk
| 5 Star
| Kit Kat |
| Store A | 52 | 26 | 41 |
| Store B | 26 | 42 | 36 |
| Store C | 58 | 19 | 23 |
| Store D | 45 | 32 | 58 |
| Store E | 65 | 45 | 52 |
| Store F | 25 | 34 | 37 |
What is the difference between the total number of chocolates sold by store D and the total number of chocolates sold by store C?
Solution
Total number of chocolates sold by store C = 58 + 19 + 23 = 100
Total number of chocolates sold by store D = 45 + 32 + 58 = 135
Therefore, required difference = 135 – 100 = 35
-
Question 3
1 / -0
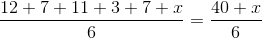
Weights of 14 employees measured (in kg) are as follows:
57, 72, 79, 84, 68, 65, 74, 71, 68, 64, 76, 68, 76, 70
i. What is the mean weight of all the employees?
ii. How many employees are there whose weight is less than the mean weight?
iii. What is the mode of the given data?
Solution
i. Mean weight =
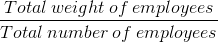
=


= 70.86 kg
ii. Arranging the data in increasing order, we get
57, 64, 65, 68, 68, 68, 70, 71, 72, 74, 76, 76, 79, 84
Hence, there are
7 employees whose weight is less than the mean weight, i.e. 70.85 kg.
iii. Mode is the number which appears most often in a set of numbers.
In the given set of weights, 68 occurs 3 times.
Hence, Mode = 68
-
Question 4
1 / -0
Marks of 11 students in a test are as given below:
32, 25, 63, 25, 12, 45, 20, 24, 51, 51, 65
For the data given above, find the mean and the median, respectively.
Solution
Mean =
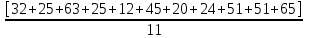
=

= 37.55
On arranging the terms in ascending order, we get
12, 20, 24, 25, 25, 32, 45, 51, 51, 63, 65
Total number of terms = 11
Median =
 th
th term = 6
th term
The median is the 6
thterm, which is equal to 32.
-
Question 5
1 / -0
The mean score of 10 students in a test was found to be 45. Later on, it was discovered that a score of 33 was misread as 53. What would be correct mean after the correction?
Solution
Mean of 10 observations before correction = 45
Sum of 10 observations before correction = 10 x 45 = 450
Since 33 was misread as 53;
Correct sum = 450 – 53 + 33 = 430
Therefore, the correct mean would be

= 43.
-
Question 6
1 / -0
If the mean of 12, 7, 11, 3, 7 and x is 9, then the value of x is
Solution
The mean is 9.
Mean =
= 9
x + 40 = 54
x = 14
-
Question 7
1 / -0
Find the mode(s) of the following distribution:
| Size | 1 | 2 | 3 | 4 | 5 | 6 | 7 |
| Frequency | 7 | 8 | 9 | 9 | 10 | 13 | 4 |
Solution
The mode of a distribution is the observation having the highest frequency. Here, the frequency of 6 is 13, which is the highest. Hence, mode is 6.
-
Question 8
1 / -0
The mean of 7 numbers is 35. When we exclude one of the numbers, the mean decreases to 31. What is the excluded number?
Solution
Let the excluded number be x.
Sum of 7 numbers = 35 × 7 = 245
After excluding x, the new total
= 31 × 6 = 186
So, the excluded number = 245 - 186 = 59
-
Question 9
1 / -0
The median of the given observations is ____________.
84, 56, 91, 20, 35, 124, 35, 127, 135, 27, 85, 63, 48, 75
Solution
Arranging the given observations in ascending order, we get
20, 27, 35, 35, 48, 56, 63, 75, 84, 85, 91, 124, 127, 135
Now, the number of observations is 14, which is even.
Median = Average of the

and

terms
= Average of the 7
thand 8
thitems
=
-
Question 10
1 / -0
Directions: Study the given line graph and answer the following question.
The given line graph shows the numbers of different animals in a zoo.
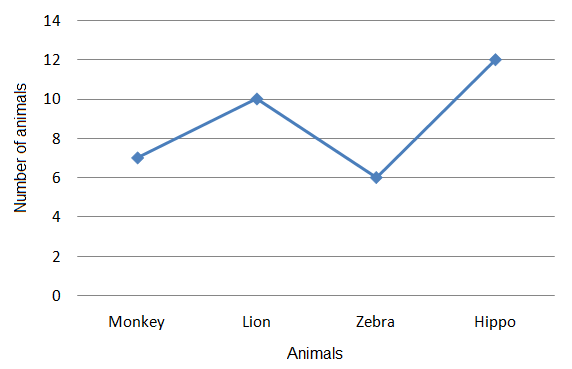
How many more hippos are there in the zoo than zebras?
Solution
Number of hippos in the zoo = 12
Number of zebras in the zoo = 6
Required Difference = 12 - 6 = 6
Therefore, there are 6 more hippos in the zoo than zebras.
-
Question 11
1 / -0
Directions: Read the following bar graph which shows the number of books sold by a bookstore during five consecutive years and answer the question given below.
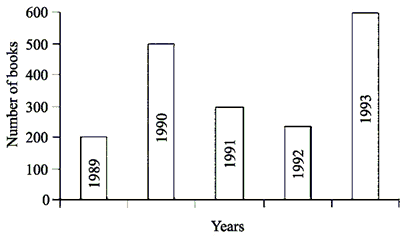
What is the difference in number of books sold in 1993 and 1990?
Solution
Books sold in 1993 = 600
Books sold in 1990 = 500
Difference = 100
-
Question 12
1 / -0
Directions: The profit of a company in four years (in lakhs) is shown by the given graph. Answer the following question.
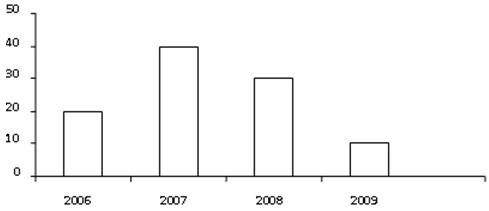
The company made the maximum profit in
Solution
Profit of the company is the maximum in 2007, i.e. 40 lakhs.
-
Question 13
1 / -0
A company makes two different products. The double bar graph shown below depicts the quantity of products sold in various years.
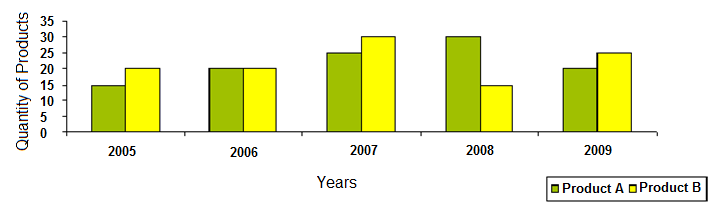
In which year is the product B sold the most?
Solution
From the graph, we can see that product B is sold the most in the year 2007.
-
Question 14
1 / -0
Directions: A company makes two different products. The double bar graph given below shows the quantity of the products sold.
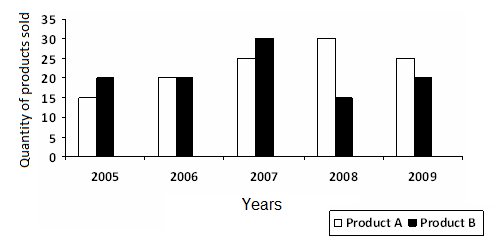
In which of the following years was the difference between the sold quantities of products A and B the highest?
Solution
Year 2005:
Quantity of product A sold = 15
Quantity of product B sold = 20
Difference = 20 - 15 = 5
Year 2006:
Quantity of product A sold = 20
Quantity of product B sold = 20
Difference = 20 - 20 = 0
Year 2008:
Quantity of product A sold = 30
Quantity of product B sold = 15
Difference = 30 - 15 = 15
Year 2009:
Quantity of product A sold = 20
Quantity of product B sold = 25
Difference = 25 - 20 = 5
Therefore, the difference between the sold quantities of products A and B was the highest in year 2008.
-
Question 15
1 / -0
Which of the following statements is incorrect?
Solution
1. Median of a given data may or may not be from the given data. This statement is true and can be explained for the following observations of data:
4, 5, 2, 7, 8, 7, 9
Now, the number of terms in the given data is odd.
So, median of the given data =

term =

or 4
th term = 7, which is present in data.
Now, let us take another set of data.
4, 5, 2, 7, 8, 7, 9, 5
Median of the given data = Average of the
and

terms
= Average of the 4
th and 5
th terms
=

= 7.5, which is not present in data.
2. Probability of getting an even number on rolling a die is less than 1. This statement is true as probability of every event is either less than 1 or equal to 1.
3. Mode of an observation may or may not be from the given data. This statement is false because mode is the most recurring term in the data and that term will be present in the data only.
-
Question 16
1 / -0
In a survey, 35 students were asked about their favourite sport and the following data was recorded:
S, S, S, H, T, T, T, B, B, B, B, H, H, H, T, T, S, S, T, B, H, H, H, H, T, S, S, S, B, B, S, S, T, T, B
Here, S stands for swimming, T stands for table tennis, B stands for basketball and H stands for horse riding.
Which two sports are favourites of the same number of students?
Solution
Number of students with swimming as favourite = 10
Number of students with table tennis as favourite = 9
Number of students with basketball as favourite = 8
Number of students with horse riding as favourite = 8
Therefore, basketball and horse riding are the favourites of the same number of students.
-
Question 17
1 / -0
Rahul collected the data regarding the age of some residents living in his society and prepared the following table:
Age Group
(in years) | Number of Residents |
| 1-5 | 20 |
| 6-10 | 25 |
| 11-15 | 30 |
| 16-20 | 28 |
Rahul decides to play a lucky draw game in which all the names of these residents are written on paper slips. Now, if one person is to be selected randomly as the winner of the lucky draw, then the person of which age group has the maximum probability of winning the lucky draw?
Solution
Since the number of residents is largest in the interval of 11-15 years, i.e. 30, the person from this age group has the maximum probability of winning the lucky draw.
-
Question 18
1 / -0
A die is rolled. Find the probability of obtaining a square number.
Solution
Total number of possible outcomes = 6
Total number of square numbers (1, 4) = 2
Required Probability =

=

-
Question 19
1 / -0
A die is rolled. What is the probability of not getting an odd prime number?
Solution
Total number of possible outcomes = 6 (1, 2, 3, 4, 5, 6)
Total number of odd prime numbers = 2 (3 and 5)
Number of favourable outcomes = 4 (1, 2, 4, 6)
Required Probability =

=

-
Question 20
1 / -0
Bruno has a bag of 3 purple balls and 10 red balls. Find the probability of selecting a purple ball randomly from the bag of balls.
Solution
Number of purple balls in the bag = 3
Number of red balls in the bag = 10
Total number of balls in the bag = 3 + 10 = 13
Probability of selecting a purple ball =
-
Question 21
1 / -0
Directions: Study the given information and answer the following question.
The line graph shows the number of cars sold by Hemant in first 4 days of a week.
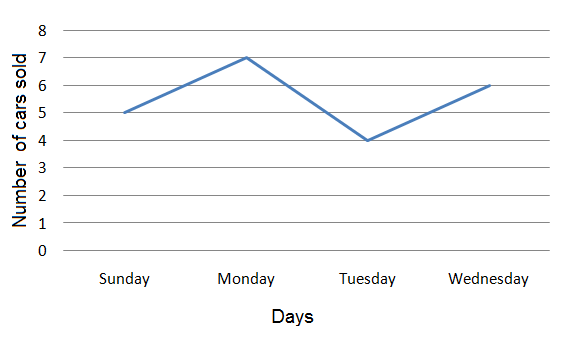
What fraction of the total number of cars sold is the number of cars sold on Monday?
Solution
Total number of cars sold in 4 days = 5 + 7 + 4 + 6 = 22
Number of cars sold on Monday = 7
Required fraction =

-
Question 22
1 / -0
The lengths (in cm) of 7 different ribbons are:
122, 131, 133, 117, 141, 132, 141.
Which of the following options has the three values arranged in ascending order?
Solution
Arrangement of lengths (in cm) of 7 ribbons in ascending order:
117, 122, 131, 132, 133, 141, 141
Mean =
=
=

= 131
Mean = 131
Total number of ribbons is 7, which is odd.
Therefore, median =

term = 4
th term = 132
Median = 132
141 occurs the highest number of times.
Therefore, mode = 141
Hence, Mean < Median < Mode.
-
Question 23
1 / -0
Directions: Study the given information and answer the following question.
The graph below shows the number of lemonades sold by Utkarsh over a period of 6 days.
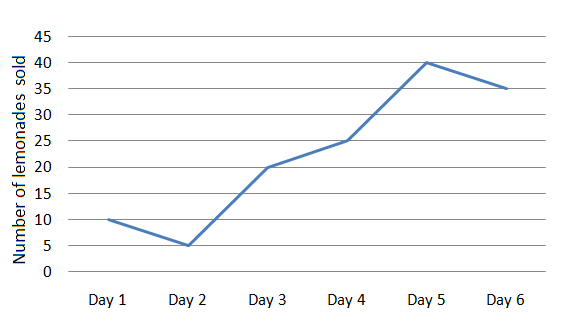
If he sold one lemonade at Rs. 12, then how much did he earn on Day 1, Day 3 and Day 5 altogether?
Solution
Total number of lemonades sold on Day 1, Day 3 and Day 5 = 10 + 20 + 40 = 70
Cost of 1 lemonade = Rs. 12
Cost of 70 lemonades = Rs. 12 × 70 = Rs. 840
-
Question 24
1 / -0
Directions: Study the given graph and answer the following question.
The given bar graph shows the number of two types of cars sold at different showrooms:
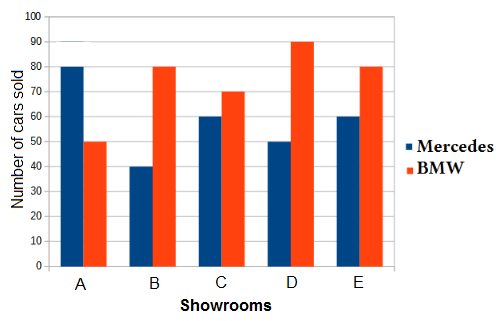
At which showroom are the sales of Mercedes more than the average sales of BMW?
Solution
Average sales of BMW =
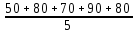
= 74
It is evident from the graph that at showroom A, the sales of Mercedes is more than the average sales of BMW.
-
Question 25
1 / -0
Directions: Study the given graph and answer the following question.
The bar graph below shows the number of fruits and vegetables sold by different sellers in a market:
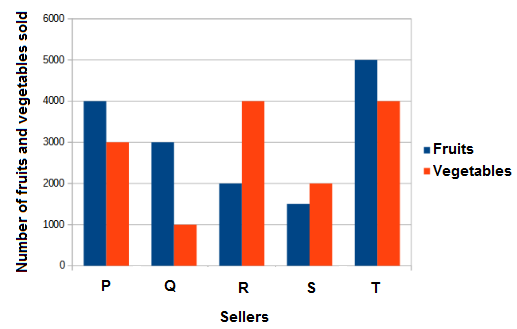
What is the difference between the average number of fruits sold and the average number of vegetables sold by the 5 sellers?
Solution
Average number of fruits sold by all the sellers =
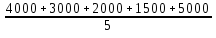
= 3100
Average number of vegetables sold by all the sellers =
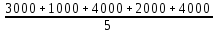
= 2800
Therefore, required difference = 3100 - 2800 = 300


 ×
×

 Sign in
 Profile
 Signout