


 Sign in
 Profile
 Signout
JEE Main 2026 Normalisation Explained - How NTA Compares Students From Different Exam Sessions


The results for JEE Main 2026 Session 2 are expected to be declared on April 20, 2026. Upon the declaration of results, you will see an NTA percentile score rather than your actual marks.
Many students do not understand why this happens or what it actually signifies. This article explains the entire standardization process in the simplest possible manner so that you can clearly understand how your score is calculated.
Why does the NTA use Normalization?
The JEE Main examination spans several days and is conducted in two shifts daily. The question paper for each shift is distinct. Although the NTA strives to maintain uniformity, the difficulty level of the question papers may still vary across shifts.
This creates an inequitable situation. A student who receives an easier question paper may score higher marks than an equally capable student who receives a more difficult one.
To address this issue, the NTA employs a standardization process based on percentile scores—ensuring that no one is unfairly advantaged or disadvantaged due to the difficulty level of the question paper.
What is a Percentile Score?
A percentile score does not tell you how many marks you obtained. Instead, it indicates the percentage of students in your shift who scored equal to or lower than you.
The formula used by the NTA is as follows:
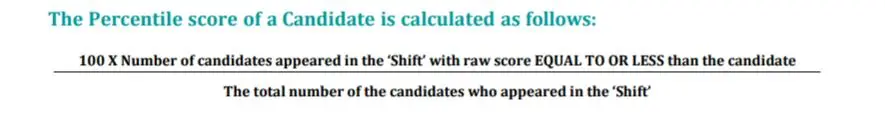
Therefore, if your percentile is 90.12, it means that 90.12% of the students in your shift scored marks equal to or lower than yours. The remaining students scored higher marks than you.
This is entirely different from a percentage. A percentage relates to marks, whereas a percentile indicates your standing relative to others.
Important Note: The percentile of the total shall not be an aggregate or average of the percentile of the individual subject. The percentile score is not the same as the percentage of marks obtained.
How are candidates distributed across the various shifts?
To maintain fairness, the NTA randomly allocates candidates to shifts. This ensures that each shift comprises an approximately equal number of students—thereby minimizing any form of bias in the allocation.
Here is an example of the distribution of candidates across four shifts —
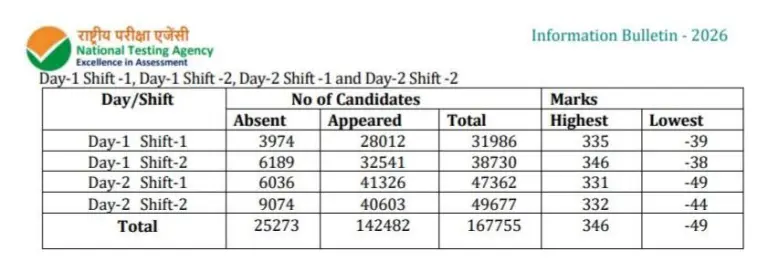
In this example, 167,755 students appeared for the examination across four shifts over two days. The highest score across the entire examination was 346, and the lowest score was -49. The highest and lowest raw scores for each shift varied—which is precisely why normalization is required.
The Highest Raw Score is Always Assigned a 100 Percentile
Regardless of which shift you appeared in, the topper of every shift is always assigned a 100 percentile score. This implies that 100% of the candidates in that specific shift scored equal to or less than the topper.
Detailed information regarding the highest raw scores across the various shifts is provided below
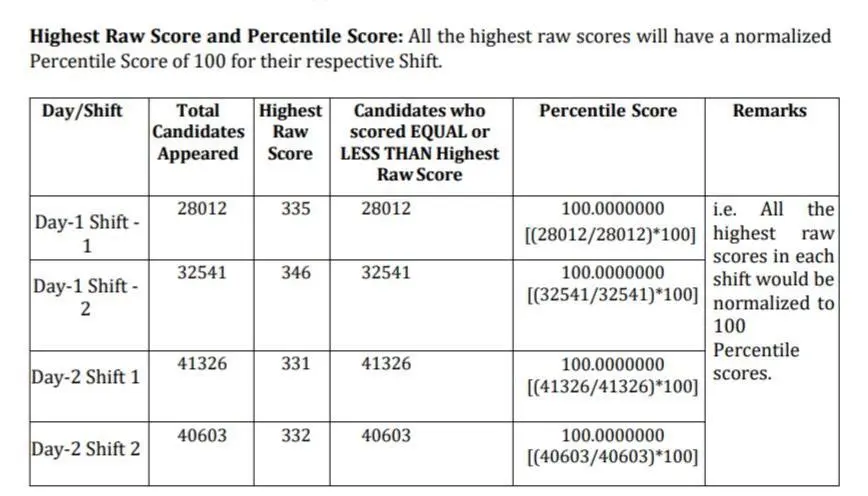
Note that the highest raw score in each shift varies—335, 346, 331, and 332. However, all four toppers receive an identical percentile score of 100.0000000. This immediately levels the playing field at the very top tier of the competition.
What about the Lowest Raw Score?
The topper always receives a percentile score of 100, whereas the candidate with the lowest score receives a different percentile score in every shift. Why is this? Because it depends on the total number of candidates who appeared for the exam in that specific shift.
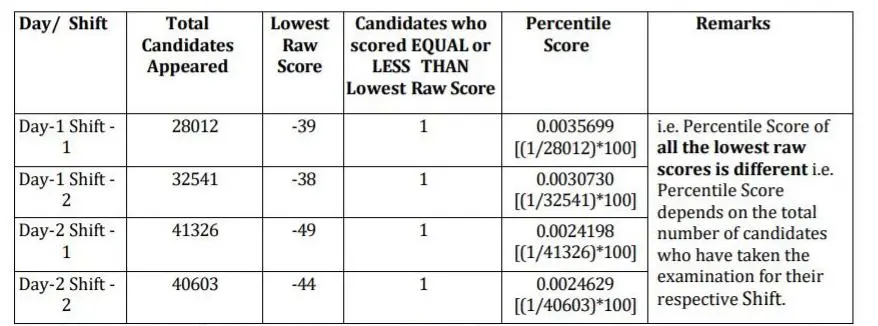
For example, in the first shift of Day 1, there were 28,012 candidates. The percentile corresponding to the lowest raw score (-39) is 0.0035699. However, in the first shift of Day 2—with 41,326 candidates—the percentile for the lowest raw score (-49) is 0.0024198; this figure differs slightly because the size of the shift is different.
This ensures that even the lowest scores within each shift are measured on an equal basis.
A Real-World Example — How Percentiles Are Interpreted
To understand this better, let us take a look at a specific shift. A total of 41,326 candidates appeared in the first shift of the second day.
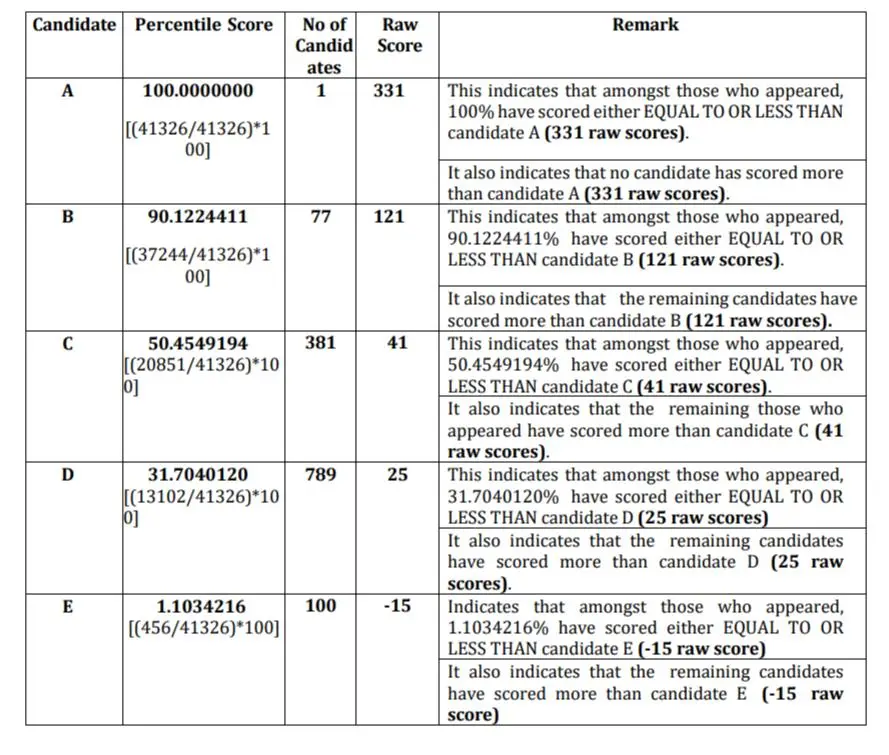
The statistics tell us the following:
Candidate A’s mark is 331 and he secured a percentile of 100.0000000. This indicates that all the students in the particular shift have obtained marks lower than or equal to 331.
Candidate B’s mark is 121 and he secured a percentile of 90.1224411. This indicates that 90.12 percent of the students have obtained marks lower than or equal to 121.
Candidate C scored 41 marks and achieved a percentile score of 50.4549194. This means that approximately half of the candidates scored 41 marks or less.
Candidate D scored 25 marks and achieved a percentile score of 31.7040120.
Candidate E scored -15 raw marks, due to negative marking, and achieved a percentile score of 1.1034216. This means that only 1.1% of the candidates scored -15 marks or less.
Thus, percentile scores provide a better assessment of your standing based solely on your marks.
The Final Formula — How NTA Calculates Your Percentile
The formula used by the NTA to calculate each candidate's percentile is straightforward.
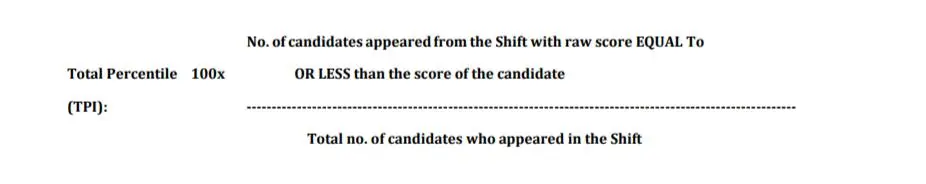
Percentile = 100 × (Number of candidates in the shift who scored equal to or less than you) ÷ (Total number of candidates who appeared in the shift)
Percentile scores are calculated up to 7 decimal places to minimize the possibility of ties as much as possible. This level of precision ensures that even minute differences in raw scores are reflected as distinct percentiles.
How is a Final Score Generated by Combining All Shifts?
During the last stage, the percentiles for each shift obtained are clubbed to arrive at the NTA scores, which serve as the foundation for result compilation and allocation decisions. This guarantees that the candidates from various shifts get assessed on a level playing field.
In case there is a variation in the percentiles associated with the cut-off marks among various shifts, the lower percentile is taken as the cut-off for that particular category.
For instance, while 40% marks translate to 78 percentiles in Shift 1 and 79 percentiles in Shift 2, all candidates who have scored at least 78 percentiles in any of the shifts would be considered eligible candidates for the general category.
Key Takeaway
Your raw score does not directly determine your rank—it is your percentile score that determines your rank. The top performer in every shift is always awarded a 100 percentile score, regardless of their actual raw score.
A higher percentile indicates that you have outperformed a larger number of candidates within your specific shift. To minimize the possibility of ties, percentile scores are calculated up to 7 decimal places. Your final AIR is based on the best percentile score obtained in either Session 1 or Session 2.
👉 READ ALSO - JEE Main 2026 Tie-Breaking Rule Explained - How Multiple Candidates Get the Same Rank After Result
👉 READ ALSO - JEE Main Result 2026: Last 5 Years JEE Advanced Cut Off; Check Category-Wise Trends
👉 READ ALSO - JEE Main Result 2026: New BTech Courses at NITs You Must Check Before Making Your College Choices
👉 READ ALSO - JEE Main 2026 Result: Expected JEE Advanced Cutoff This Year; Check Category-Wise Analysis
👉 JEE Main & Advanced Study Material


 Quiz
Quiz


